Understanding Your Dashboard
The PraxPilot dashboard is your central hub for managing cases and monitoring your workflow.
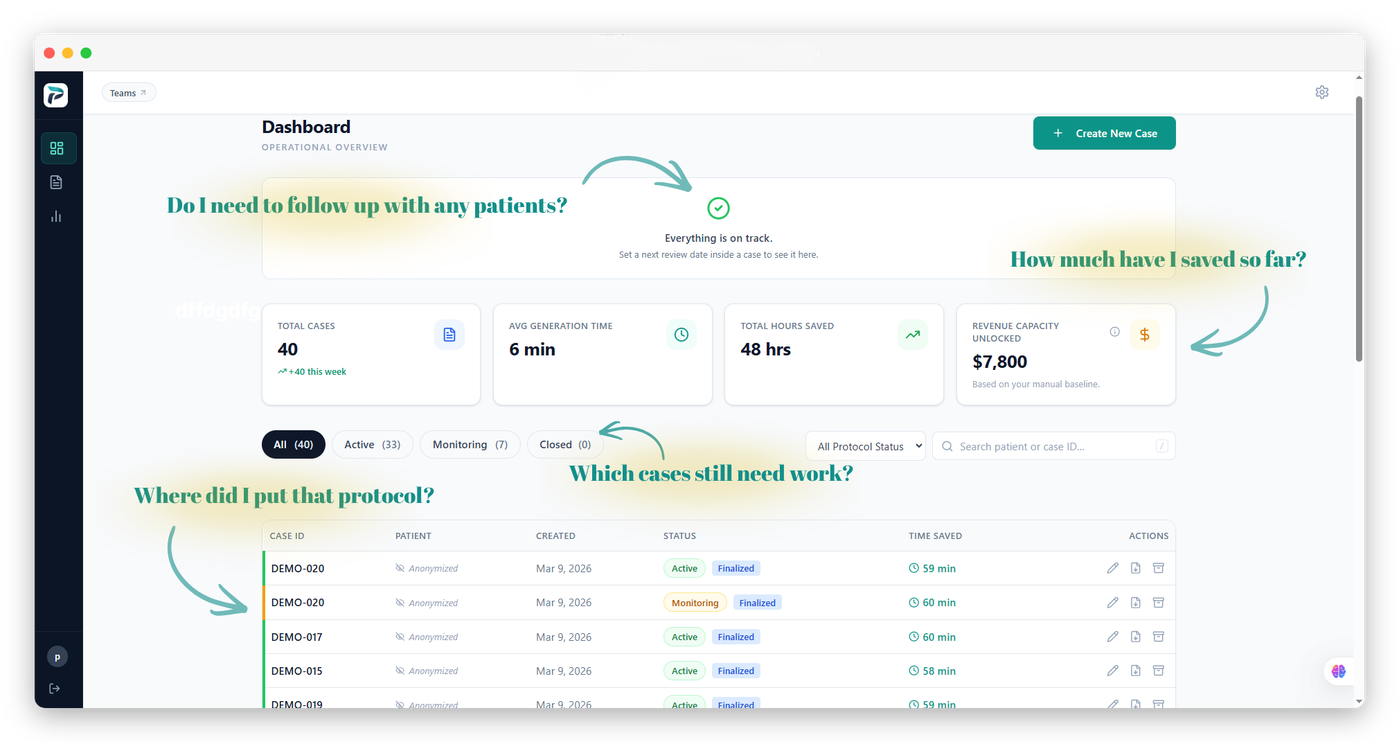
Key Dashboard Elements
Case List
All your cases are displayed here. You can filter by status (Active, Monitoring, Closed) and search by patient identifier or date.
Quick Stats
At a glance, you can see:
Total cases created
Protocols generated
Estimated time saved
Revenue capacity unlocked (based on your practice settings)
New Case Button
Start a new case directly from the dashboard.
Recent Activity
See your most recently updated cases for quick access.
Navigating Cases
Click any case to open it. From inside a case, you can view the intake, the generated protocol, version history, and activity log.
Filtering and Search
Use the filter bar to narrow cases by status or date range. Use the search field to find a specific case by identifier.